Demographics reports summarize all of your people based on various properties like gender, group, status, type and custom fields.
When to use this report
End-of-year reports for management.
Better understand the makeup of your volunteer base, or to compare one group of volunteers against another.
Steps in this task
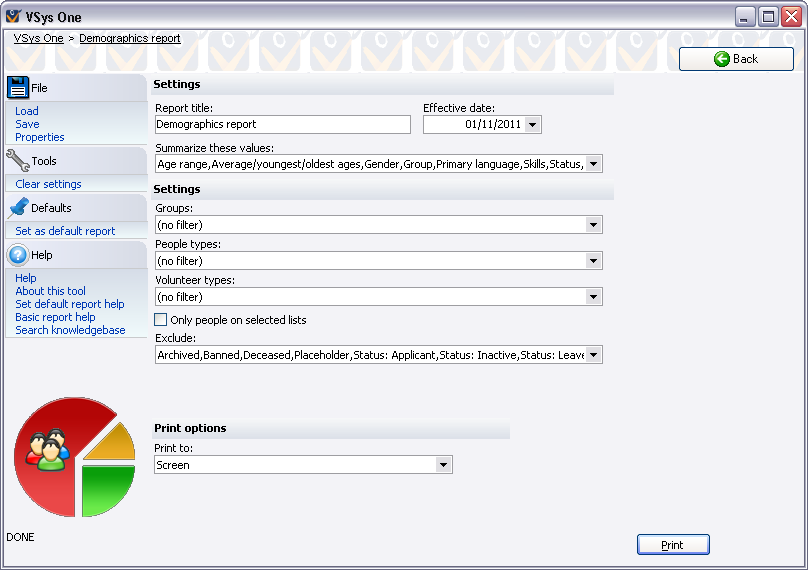
Click on Demographics from the Reports panel.
Give your report a title, choose the date for determining when volunteers are active/inactive/etc.
Choose the fields to be summarized. Available fields include Additional groups, Additional languages, Additional types, Age range, Average/youngest/oldest ages, Contact flags, Gender, Group, Job preferences, Primary language, Reason archived, Reason inactive, Skills, Special needs, Status, Team, Type, Volunteer source, Volunteer type and Wheelchair. In addition, any custom field which is a checkbox, drop-down or checklist can be summarized here as well.
Filter your volunteers by group, people type, volunteer type, or list.
Optionally exclude out people who are inactive, archived, etc.
Click Print to run the report.
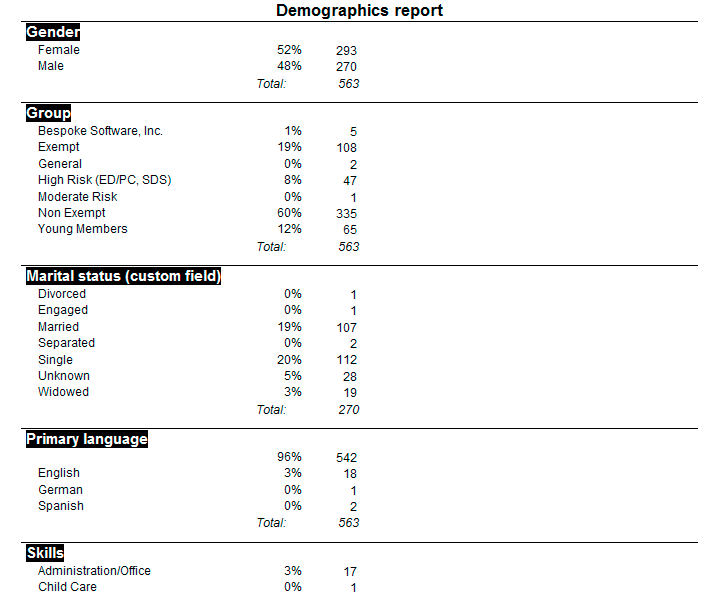
Sample
Fields which can have multiple values, like Skills, can total to more than 100%.
If you see a group of something like WURF57A5WM46HJPG as a group name, you have people with no group. This can happen if the group is deleted, but not the members. To find these volunteers, use an Intellilist with all the volunteers in your database, then subtract the ones that have valid groups.